PRODUCTION
Track industry-standard KPIs for complete visibility into machine performance and benchmarking plant processes
See how PRODUCTION can help you make data-driven decisions to boost machine productivity here.
Optimize Machine Performance by tracking key, industry-standard metrics such as OEE, Quality and Uptime. Review and understand the big picture at the plant and line level, details at the machine level, and create alerts and production reports.
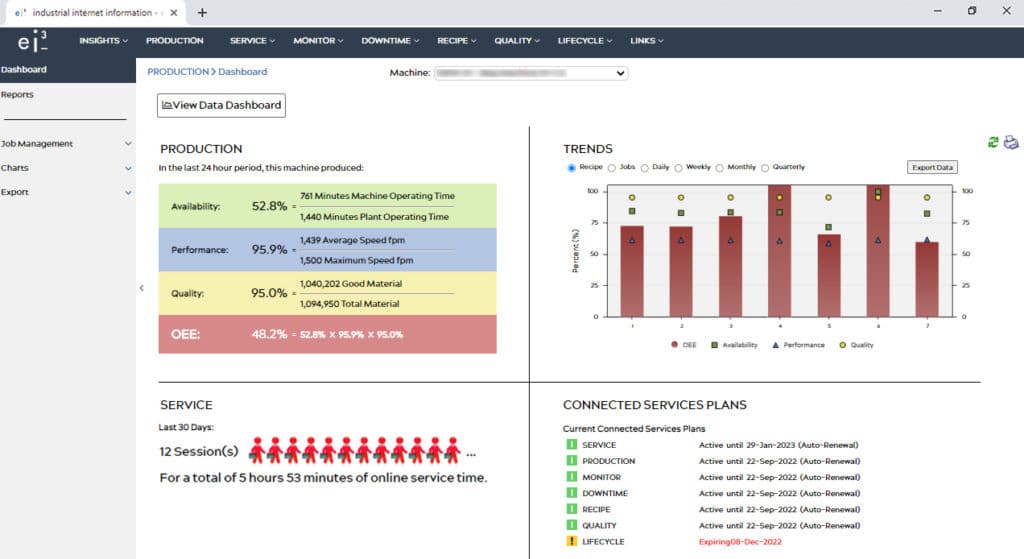
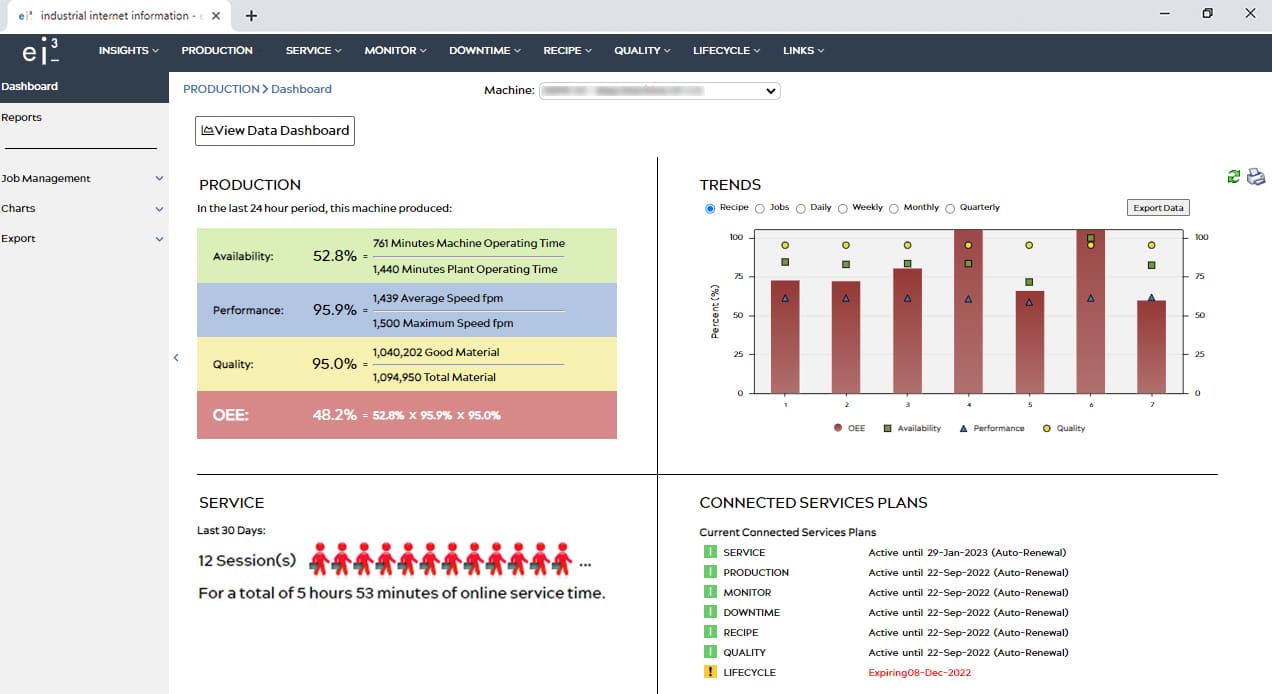
This ei3 app allows management staff to understand performance at the plant, line, and machine level. It helps get relevant production data like OEE, Availability, Performance, Quality and more at the click of a button.
This data, in the form of customizable, easy-to-understand reports, helps:
- Achieve full visibility into accurate machine conditions
- Set realistic production targets and deliver upon them
- Improve plant performance with practical insights
- Receive alerts if production targets are not met
- Use ei3’s scrap tracking to receive alerts when a scrap incident occurs and review operator notes to understand the ‘why’ and prevent future scrap
- Ask operators the right questions to understand machine downtime causes
- Encourage a data-centric, performance-driven management culture
- Maximize production output by benchmarking plant and production processes

This ei3 app allows management staff to understand performance at the plant, line, and machine level. It helps get relevant production data like OEE, Availability, Performance, Quality and more at the click of a button.
This data, in the form of customizable, easy-to-understand reports, helps:
- Achieve full visibility into accurate machine conditions
- Set realistic production targets and deliver upon them
- Improve plant performance with practical insights
- Receive alerts if production targets are not met
- Use ei3’s scrap tracking to receive alerts when a scrap incident occurs and review operator notes to understand the ‘why’ and prevent future scrap
- Ask operators the right questions to understand machine downtime causes
- Maximize production output by benchmarking plant and production processes
- Encourage a data-centric, performance-driven management culture

What kind of data do our reports show?
Is it easy to understand?
Our app creates productivity charts that detail key performance metrics for industrial assets in your manufacturing plants. These metrics include OEE, machine Availability, Performance, Quality, Scrap, Duration, Stops and more, plus any additional KPI you need to monitor.
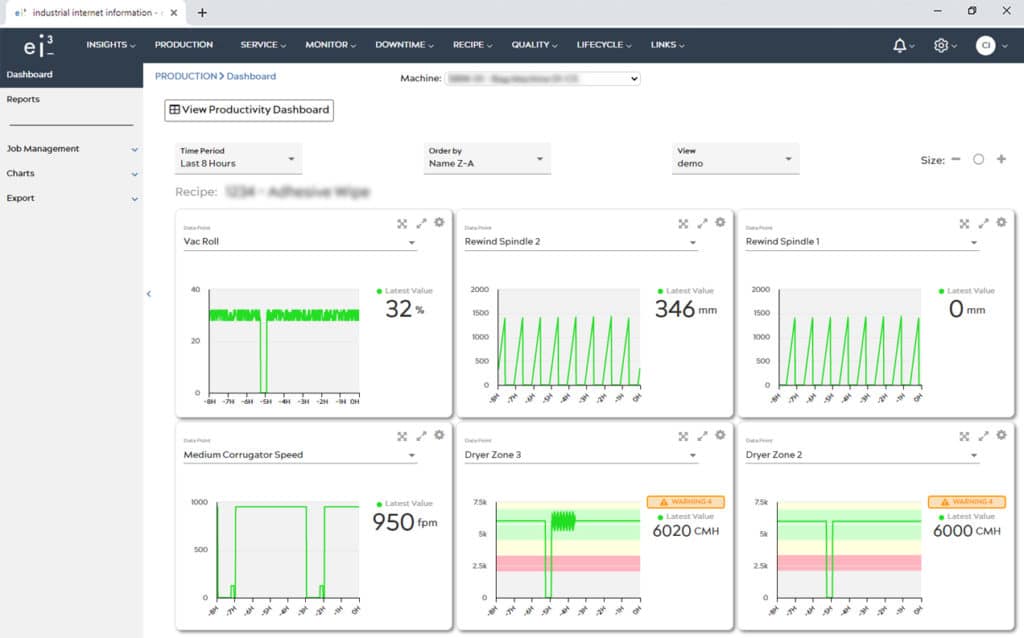
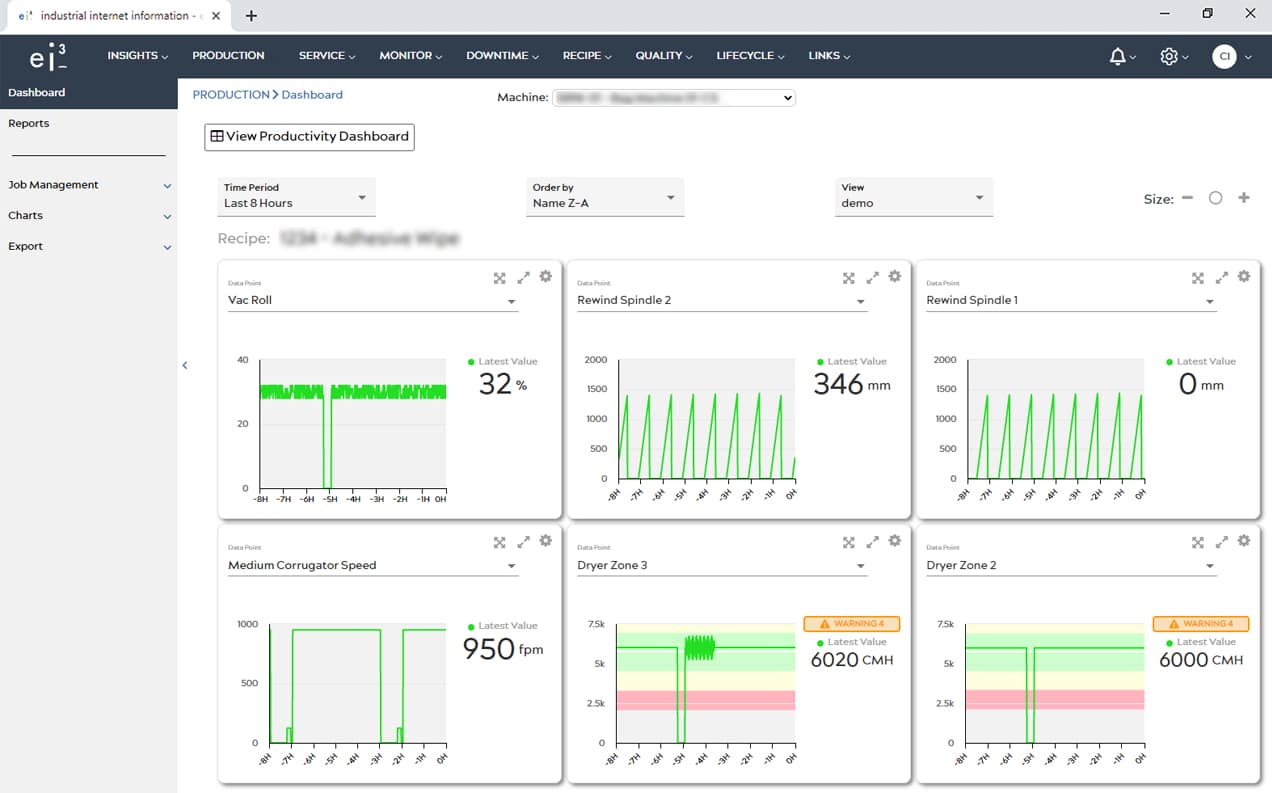
You can view this data on engaging, customizable dashboards and expand into technical machine aspects when and where needed, letting staff understand trends without adding complexity. The data is presented by shift, day, machine, facility or enterprise-level filters as required for quick decision-making.
Your factory without PRODUCTION
Our app creates the key data to enable management and factory floor personnel to work together to improve operations. Without the app key issues often go unnoticed or arise, such as:

Product Inconsistency
In the absence of timely production reviews, warning signs do not arrive when needed. This can result in costly errors and inconsistent products, where troubleshooting becomes reactive.

Increased Downtime
Without understanding the status of their machines and working closely with operators and maintenance personnel, added downtime is inevitable.

UNMEASURED SCRAP PRODUCTION
Tracking scrap material efficiently is key to gaining valuable insights from scrap data and reducing unnecessary waste. Failure to measure scrap also leads to inaccuracies in calculating Quality and, consequently, OEE values.

Lack of Accountability
Accountability suffers if managers cannot determine the causes of performance drops or ask the right questions to their technical teams.

Faulty Decision-Making
Managerial decisions taken without factual awareness affect operations on the factory floor without any positive results.

Scalability Issues
Plant operators and managers find it hard to scale up and produce at a higher level if they don’t examine actionable, data-driven reports.
The ei3 Advantage

Versatile
Users can choose from a host of standardized report templates while also having the option to create custom reports
Automated
Can schedule email delivery of configured reports to users and groups in a variety of formats, including pdf, excel and text
Instant and Consistent
Enables real-time reporting of production information
Customizable
Comes with a suite of user configuration tools
Meticulous
Integrates work orders, production orders, quality, downtime and process parameter results
The ei3 Advantage
Versatile
Users can choose from a host of standardized report templates while also having the option to create custom reports
Automated
Can schedule email delivery of configured reports to users and groups in a variety of formats, including pdf, excel and text
Instant and Consistent
Enables real-time reporting of production information
Customizable
Comes with a suite of user configuration tools
Meticulous
Integrates work orders, production orders, quality, downtime and process parameter results

Incorporating PRODUCTION on the Shop floor


STEP 1. COLLECT
Our app can begin collecting data securely from your existing machine infrastructure with ei3’s easily integrated edge devices. Users can set parameters and KPIs that need particular attention to begin benchmarking.

STEP 2. ANALYZE
A single click can generate reports that outline crucial production information in an easy-to-understand format. The app can follow an automated schedule to generate these reports, dispatching them to relevant personnel in various formats.

STEP 3. IMPROVE
These reports allow you to track production performance against previously set targets. You can view machine performance per shift, day, machine or even an entire facility. All of these can help with troubleshooting and continuously improving plant performance.

STEP 1. COLLECT
Our app can begin collecting data securely from your existing machine infrastructure with ei3’s easily integrated edge devices. Users can set parameters and KPIs that need particular attention to begin benchmarking.

STEP 2. ANALYZE
A single click can generate reports that outline crucial production information in an easy-to-understand format. The app can follow an automated schedule to generate these reports, dispatching them to relevant personnel in various formats.

STEP 3. IMPROVE
These reports allow you to track production performance against previously set targets. You can view machine performance per shift, day, machine or even an entire facility. All of these can help with troubleshooting and continuously improving plant performance.

