If your facility isn’t measuring Overall Equipment Effectiveness (OEE) by utilizing the industrial internet, your company is likely losing out. That sounds like a bold assertion, but consider this: a facility with an OEE score of 85 or higher is considered world class. However, 40 is a fairly common score for facilities just starting to measure OEE. The disparity drives the growing adoption of cloud-based, OEE measurement Software-as-a-Service (SaaS) solutions embedded throughout the manufacturing line.
According to a 2013 report by Mint Jutras, 22% of all manufacturing and distribution software installed supports SaaS-based applications, and that number is projected to grow to 45% over the next ten years. It takes more than baby steps—manual Excel calculations, incompatible measurements, or systems that don’t disseminate data until after something has gone wrong—to make strides to the top scores. As SaaS becomes more compatible with machinery, the opportunity to improve OEE is ripe for the taking.
Do the math
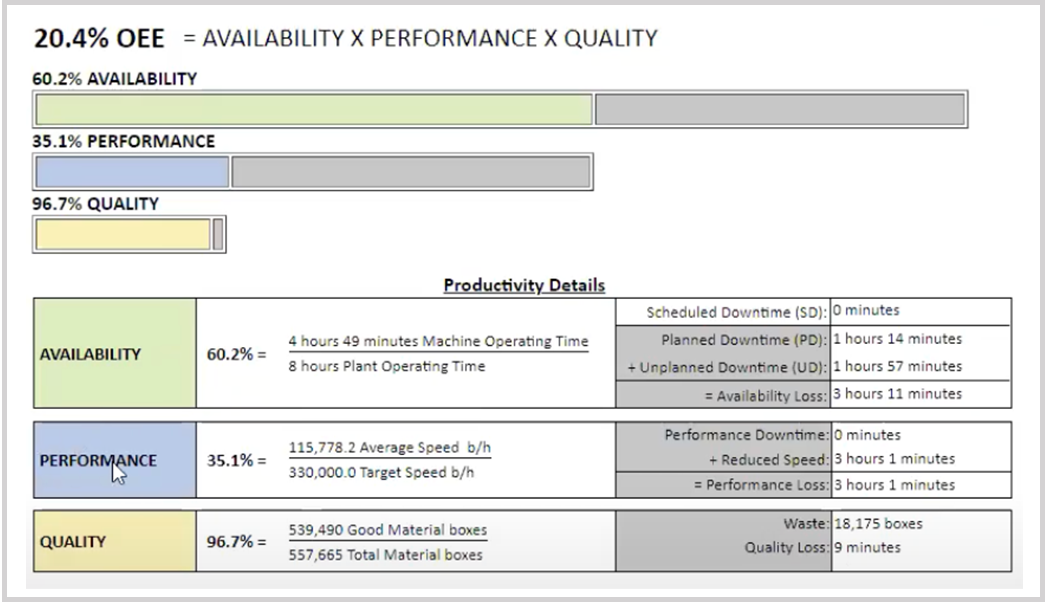
In doing the math, all three parts of the equation become a number between 0 and 1, respectively—or a percentage. Once calculated, the final OEE number will still land between 0 and 1. Regardless of method, the interpretation of the results remains the same: facilities with a score of 85 or above are considered to be producing with a great balance of availability, a lot of throughput and very high quality.

Fig 1. Calculation of OEE
In doing the math, all three parts of the equation become a number between 0 and 1, respectively—or a percentage. Once calculated, the final OEE number will still land between 0 and 1. Regardless of method, the interpretation of the results remains the same: facilities with a score of 85 or above are considered to be producing with a great balance of availability, a lot of throughput and very high quality.
Balancing the numbers isn’t always an easy task. There can be a powerful management tradeoff. An operator might run a machine at top speed to maximize the performance aspect of OEE, but this may result in frequent breakdowns or create additional waste. In this instance, raising the performance could bring down the availability or quality.
The effective optimization of all three requires balance, and this balance is improved by real-time remote monitoring. This is best achieved by harnessing the power of the industrial internet via SaaS, moving through four steps: gathering, processing, benchmarking, and disseminating data.
Step 1: Gathering the data
It’s a challenge to confirm progress when measurements are not universal. In order to successfully gather data from machinery on the line, it must be independent of the machine type, maker, model year, and the kind of automation employed by the equipment. A typical facility manager typically oversees equipment from multiple suppliers, and for certain, they are not providing data in a universal format. Compatibility is critical and software must be nimble and able to parse information into universally applied data for manufacturers to see an accurate picture of their equipment’s efficiency.
Gathering data in the cloud is the most effective and efficient way to do this. It minimizes the strain on the end-user organization to coordinate computers, databases, and networks required in maintaining so many data connections. By streamlining and hosting those functions, the remote monitoring cloud can make gathering data a more manageable customer experience; delivering greater value through an OEM’s monthly monitoring service.
Step 2: Processing the data
The key advantage to using the remote monitoring cloud to measure OEE is that all data streams coming from all the different machines on a factory floor are processed in the same way. Because the data is similarly processed, it offers certainty that things are viewed on a level playing field. Having consistent, transparent, and understandable methods for measuring and computing OEE provides greater assurance in making business decisions and fairness for all parties involved.
Progressive OEMs know that delivering maximum performance in terms of OEE is the best way to help customers achieve the highest return on investment (ROI) and successfully meet or exceed production goals. They also understand the negative impact of the downtime. Yet, still, many machine builders only focus on the top rated speed of the machine. An OEM that understands OEE and the proper use of benchmarking data gains a competitive advantage over an OEM that can only tout gains in speed.
It is surprising, but many OEMs don’t have any measurable data on how much downtime their machines incur. However, the downtime number should be considered as important to the end customer as the performance number because both carry equal weight in the OEE equation. Additionally, end-users around the world that have been using OEE as a best practice for measuring productivity place greater emphasis on the availability number in equipment investments.
Step 3: Benchmarking & utilizing the data
When companies first start to measure OEE, it is typically lower than what they expected—and in some cases way under the world class scores of 85. The reason is often this: it’s difficult to compute an accurate OEE number when critical shop floor operational info is unknown. This information goes beyond the boundaries of just the machine itself.
When calculating OEE, manufacturers should consider several factors:
- When is the factory scheduled to be operational?
- What other operations-related detail must be factored to paint a bigger picture?
- How will all of this information be processed?
In 2014, we still see a lot of Excel worksheets and homegrown OEE calculations that are manually tabulated by in-house admins. Those computations do not always follow the industry standards, and therefore cannot facilitate a level playing field—especially when comparing one facility against another.
Manual systems cannot easily collect and organize data as quickly, deeply, and seamlessly as remote monitoring systems can. Additionally, the remote monitoring cloud provides customers a way to categorize and catalog their times of operation for their shop floor. Machine running time and downtime for cleaning and planned changeover should be considered and should not count against the machine’s OEE scores.
Step 4: Disseminating the data
Delivering the data to key players in real time is central to maximizing OEE. There are several options for getting information to the right person at the right moment, but two in particular are very effective.
First, for operators on the floor, an Andon Display equipped with the right software solutions can work like a large scoreboard above a given line. Individuals who monitor multiple lines can walk the floor and immediately see which ones meet their numbers and which fall short. This system works more efficiently by clearly displaying the downtimes of equipment, attracting the attention of personnel for swift repairs.
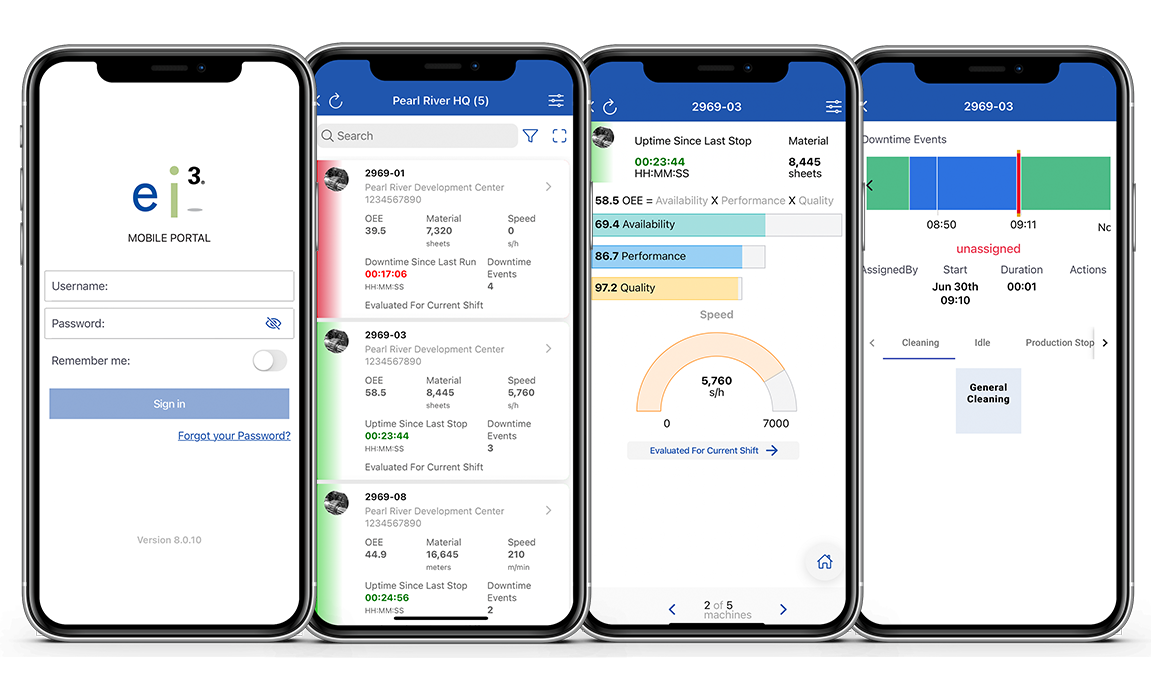
For off-site personnel, mobile apps can deliver key metrics for OEE. Plant managers need only look to their phones or tablets to find the vital metrics. They can scan a device and know immediately if the facility requires a call to address a problem.

Fig 3. ei3's Mobile Application offers comprehensive machine productivity metrics,
enabling effortless tracking of OEE, downtime, uptime, and other KPIs at your fingertips.
Customers that pursue OEE seriously must feed real OEE info into their business systems, such as SAP or Oracle. Empowering those systems with accurate, real-time information will result in greater strides toward OEE goals. Collecting data from machines and then processing, measuring, and benchmarking that data – all in real time with all of the nuanced factors and variables accounted for— will put manufacturers on the road to calculating their OEE more accurately, identifying areas for improvement and pursuing solutions for success – change nothing else.


