This post summarizes the presentation by Spencer Cramer, the CEO and founder of ei3, at the Sustainable Packaging Coalition fall 2012 meeting.
Recently, I was asked by a client to investigate how ei3’s remote monitoring cloud was making degree day calculations. The client had noticed a change of 17% less heating degree days for a large group of buildings spread out across North America. This change seemed to be too big to be correct because previous year-on-year changes were only around 2%. Was there a math error? In response, I researched the climate records at NOAA and found that 2012 is on track to be an exceptionally warm year. This chart reveals a very disturbing fact about the weather in the lower United States.
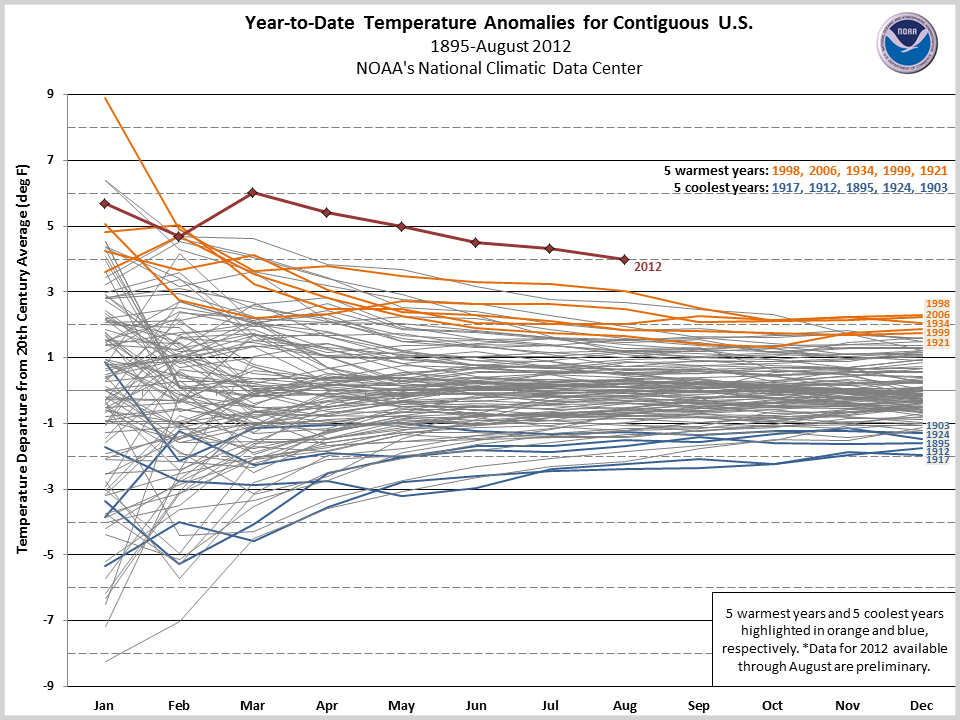
Fig 1. NOAA year-to-date temperature anomalies graphic, 2012
In this graphic published by NOAA, the year-to-date temperature anomalies for the contiguous United States are plotted. In the center of this chart on the y-axis, a data value of zero indicates the mean temperature for the year to date is equal to the average of the past 117 years.
For professionals who are working in the business of Sustainability, I think the information in this chart is valuable.Amid the ongoing debate on CO2 emissions’ role in climate change, the current U.S. year-to-date average temperature running 4 degrees above the century norm signals a noteworthy shift.
While the debate continues about whether CO2 emissions are the cause of climate change, seeing that the year to date average temperature in the United States is running at 4 degrees above the hundred-year norm makes me think that something important is occurring.
Has our climate begun to change as a result of CO2 emissions? Years ago some scientists warned us that once we reached 350 PPM of CO2 in the atmosphere we would pass a tipping point, there was even a movement called 350.org. Our current CO2 level is at 392. If there is even a small chance that carbon dioxide emissions are behind this change, recent climate events indicate that everyone needs to work hard to reduce our emissions, or we may incur grave consequences.
To manage energy consumption and greenhouse gas emissions, first one needs to measure; Following the well-known best practice of “you can’t manage what you can’t measure,” packaging manufacturers will need to first measure their energy use. Then they can use this information to better understand what is the energy use and sustainability of their production to launch meaningful reduction strategies. I see this as an exciting new opportunity because by measuring the Carbon emissions of package production, we are creating a lens through which we can begin to understand and then reduce these greenhouse gas emissions – while at the same time increasing our business competitiveness. Using less energy means paying less money to the utility company, thereby creating cost savings that can ultimately become a competitive advantage for a manufacturer. The good news is that there is a way to measure energy used and greenhouse gas emissions on the production floor and it is not hard.
The opportunity for energy and CO2 reductions in manufacturing
In a report made back in 2007, the IEA attributed 33% of energy use and 36% of CO2 emissions to manufacturing industries. So working on reductions in the manufacturing process holds the promise of significantly reducing our emissions. In fact, this same IEA report claims that by implementing commercially available advanced technologies, we could reduce global CO2 emissions by 7 to 12% and reduce energy use by the equivalent of the entire energy use of Japan.
Advanced technologies already in commercial use would reduce global CO2 emissions by 7 to 12%, and be the energy equivalent of taking the entire country of Japan off-line.
Packaging manufacturers have a great opportunity to realize cost savings while improving the sustainability of their products. In fact, savvy companies are already using sustainability as a lens through which to view and drive performance. Implementing a sustainability program within the enterprise can have a positive impact much like a Total Quality Management program. By pursuing a sustainability program, companies can spend less on their purchased energy while maintaining their competitiveness.
The US Department of Energy has recently announced a program called Superior Energy Performance that aims to help manufacturers achieve the goal of reducing energy consumption while maintaining competitiveness. SEP follows the ISO 50001 standard to help companies plan improvements, measure results, and get certified. With 3-year reductions of 5%, 10%, and 15%, silver, gold, and platinum certifications are granted. The companies who participated in the pilot program include Volvo Trucks, Dow Chemical, and 3M, who all achieved reductions of more than 15%.
Throughout the supply chain, bellwether companies are seeking accurate sustainability data. This trend is growing, and manufacturers will be challenged to provide the CO2e emissions values for the items they produce. The sustainable supply chain is spawning investment into new companies that are developing novel business models to aggregate and track sustainability information. One reason these efforts are made is to enable accurate Scope 2 and Scope 3 emissions reporting into monitoring bodies such as the Carbon Disclosure Project. As awareness grows, sustainability will have an increasingly prominent role in business decisions.
The sustainability of packaging
The manufacture and conversion of packaging materials play a crucial role in the sustainability of any product. I am an active participant in the Sustainable Packaging Coalition (SPC), a project of GreenBlue. By measuring the sustainability of the manufacturing and conversion phases of packaging, it is possible to get closer to understanding the total sustainability of a package’s lifecycle.
The SPC recognizes the Global Packaging Project, and this organization has published a Global Protocol on Packaging Sustainability. One key metric prescribed is the Cumulative Energy Demand or CED. The CED indicates the total amount of energy used to produce a package, a key factor in understanding the sustainability of a package. Using the CED and the local carbon intensity of energies used, it becomes possible to describe the CO2e emissions for each package produced. The CO2e number is a metric of great interest to organizations looking to report their sustainability.
Further, the Greenhouse Gas Protocol defines Scope 3 emissions, including “Other indirect emissions, such as the extraction and production of purchased materials and fuels, transport-related activities in vehicles not owned or controlled by the reporting entity.” So, in the context of packaging and from the perspective of further up the supply chain, Scope 3 CO2e emissions are those resulting from “the production of purchased materials,” which in many cases describes the packages provided to global brands. Of course, from the point of view of the manufacturer or converting factory, these emissions are reported as scope 2, and even scope 1 in certain cases.
Despite having a clear rationale for measurement and reporting, manufacturers are challenged by the difficulties involved and often cannot provide good information about the sustainability of their packaging. Measuring and reporting require a diverse set of data to be accumulated and advanced analysis. At the most basic level, the report needs to include information about:
- Machine production information
- Utilities used, including electricity, water, fuels, compressed air, steam, hydraulic
- Waste produced during manufacture by stage
- Building energy use
- Carbon intensity of the supplied energies
- Local weather
- and other relevant factors
Getting all of this information and processing it into CO2e numbers is a daunting task. For most organizations, it is not practical to produce reports using manual Excel worksheets. The time required for data collection and analysis is not scalable. As a result, too often, organizations become willing to settle for reporting approximations in lieu of accurate numbers.
The emerging solution: A remote monitoring cloud application that can measure, compile, and report on energy and CO2 emissions
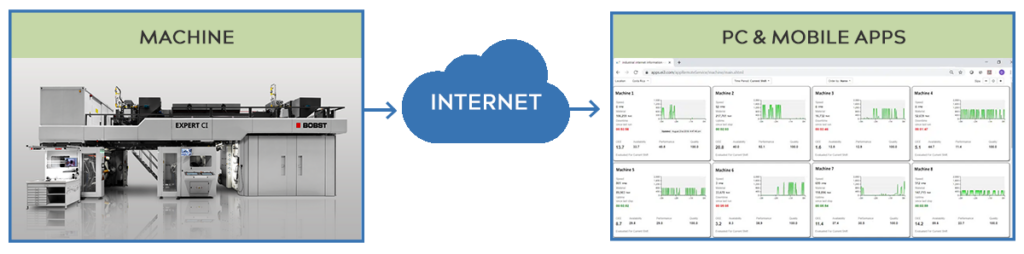
Remote monitoring is a specialized cloud computer application that connects to energy meters and control systems of machines, gathers data about production, energy use, and stores the data in a network of global data warehouses. At the data warehouses, dedicated high-performance computers analyze this data to compute key performance indicators for production, quality management, and resource consumption.
These key performance indicators are then reported to provide accurate timely data about the sustainability of produced materials. Sustainability and production are tracked by machine, by the in-house job, in real time or historically.
The remote monitoring cloud also tracks other variables, including the outside temperature of the manufacturing plant and local grid carbon intensity. Users view information on mobile apps, web pages, dashboards, and reports, and the information can be linked into other computer systems using web services.
Remote monitoring of machines is part of a rapidly growing trend called “The Internet of Things (IIoT)” This term was made popular in an April 2011 white paper by Dave Evans, Chief Futurist of Cisco Internet Business Solutions Group, where he presents that the Internet of things was “born” somewhere between 2008 and 2009 when more devices were using the internet than people.
Remote monitoring is delivered using the internet business model called Software-as-a-Service, or SaaS. This is growing in popularity because SaaS enables an organization to save time, save money, get access to the latest technology, and focus on their core business. This highly secure method is ideal for remotely monitoring machines because it eliminates the need for complex monitoring systems to be deployed in manufacturing sites.
Manufacturers use remote monitoring to make enlightened business decisions by using real-time information about the production, quality, and status of equipment. By using the existing control systems already in place on machines, it is possible to build a powerful monitoring capability without incurring significant investment. This is made possible by the fact that usually, all the necessary pieces are in place for monitoring except the cloud interface equipment.
Delivering sustainability metrics: The journey from machine to mobile
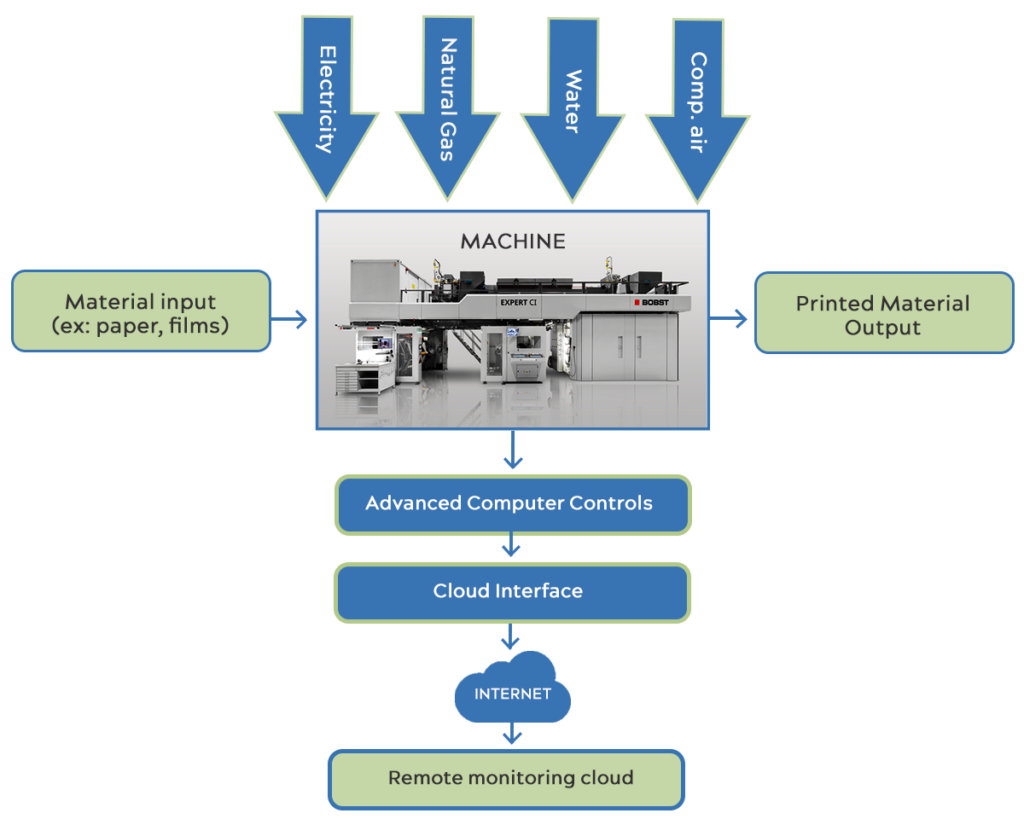
Consider the example of how Bobst is using remote monitoring to provide customers with the ability to measure and report on sustainability. The Bobst printing machine shown below is a Flexographic web-fed printing press. It can print on various substrates to produce cartons, bags, boxes, and labels. This machine runs up to 2000 Feet per minute and can process webs of 110 inches wide or almost 10 feet. This machine can be equipped with remote monitoring of electricity, fuels, water, and compressed air.
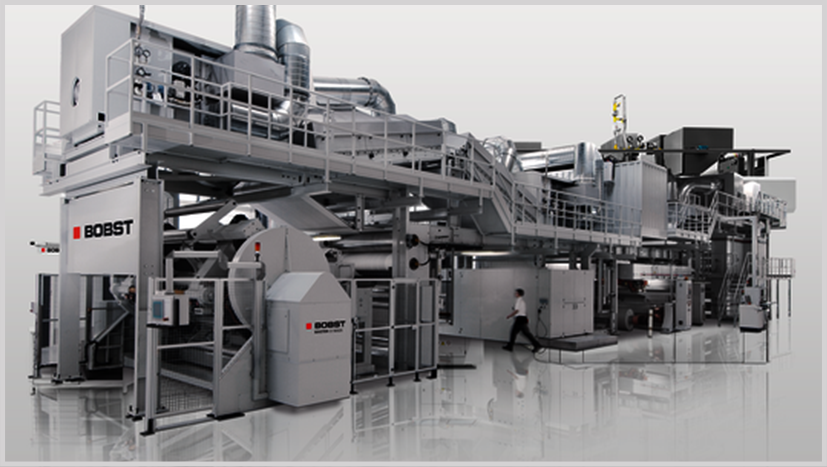
Fig 2. Bobst Flexographic Web-Fed Printing Press
Bobst is the world’s leading supplier of equipment and services to packaging manufacturers in the folding carton, corrugated board, and flexible materials industries. Founded in 1890 in Lausanne, Switzerland, Bobst has a presence in more than 50 countries, runs 11 production facilities in 8 countries, and employs over 5,000 people around the world.
Like all current Bobst equipment, this printing machine has an advanced system of computer controls that manages the many functions performed in the production. This particular machine also has sensors that measure sustainability factors, including the electricity for operation, gas for its dryers, water for its cooling rolls, and compressed air to make things move. Each of these sensors is connected to the machine’s computer controls. Once the sensor values are represented in the control system as digital numbers, the remote monitoring cloud interface gathers these values. These digital values become the data that flows securely from the machines to the remote monitoring cloud’s global network of data warehouses.
At the data warehouse, powerful internet servers work to create web pages, dashboards, and reports for users. It is noteworthy to mention that this same method can work with existing and older machines. Depending on the machine, new sensors might need to be added, and in some cases, a new data collection box is installed (if the existing machine does not have compatible control). In practice, any machine on the production floor can be monitored, thereby providing the manufacturer with a complete and accurate picture of production and sustainability.
Once the data reaches the data warehouse, the remote monitoring cloud knows the consumption of electricity, fuels, water, air, per unit of time and unit of production. This data is computed into informational key performance numbers, or KPI numbers. For example, a report can be made showing the energy used per unit of production, analyzed on a job-by-job basis. These KPI numbers are modeled to establish baseline values. This is very important because the baseline values are used to benchmark performance and are used later to verify if energy reduction projects achieved their targeted goals. For reporting energy use to partners and customers further down the supply chain, the benchmark values for the energy performance per unit of production are the core numbers that meet the definition of transparent reported Cumulative Energy Demand, or CED.
Converting the CED into a number that can be reported showing the unit of production’s carbon footprint calls for understanding the carbon intensity of the local electrical supply and other energies delivered. Because the remote monitoring cloud has a database of local carbon intensity values, these values are integrated with the energy of production, providing the CO2 emissions per unit of production. This number is provided to supply chain partners for their reports or reported as part of the manufacturer’s Carbon Disclosure Statement.
A manufacturing sustainability report is provided by the cloud server, and it can be customized for different organizations. In its most basic form, the key metrics of energy consumption and CO2 emissions are provided on a job-by-job basis, showing the values of units produced, analyzed by the job with the Energy and CO2 metrics provided.
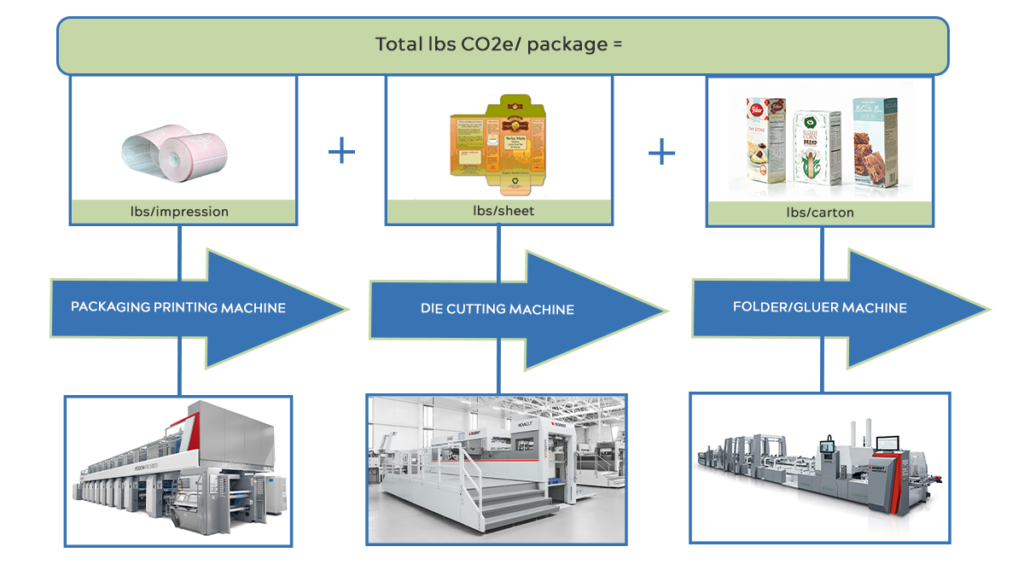
Most packages and products require operation on more than one machine. When all the machines in a process are connected to the remote monitoring cloud, their Energy values are measured, and an aggregate energy per unit can be reported along with the associated CO2e. This aggregation method provides a report of the total impact of the converting stage of the package. Having the energy use data helps with planning machine upgrades and even production scheduling.
ei3’s remote monitoring cloud is a practical and effective way to measure and report on the sustainability of packages made in the converting plant. Plant personnel use the mobile apps, web pages, dashboards, and reports to use sustainability key performance indicators as a lens through which operations can be analyzed and improved. With accurate real-time sustainability data, machines can be benchmarked in ways that help enlighten decisions about production and machine improvements. This information can be aggregated for multi-stage operations to create a complete CO2/unit of packaging, thereby providing a transparent standards-based report.
This is just the beginning. As more enterprises start to measure, they will join a growing community that is seeking ways to reduce energy consumption and CO2e emissions while maintaining effectiveness. There is still much to be learned and lots of work to be done to solve the challenges ahead. My goal is to see that ei3 provides the packaging industry with innovation, excellence, and leadership required to define the limits of what is possible for the measurement and reporting of these important metrics.