.svg)


.png?width=20&height=20&name=Vector%20(1).png)


.svg)
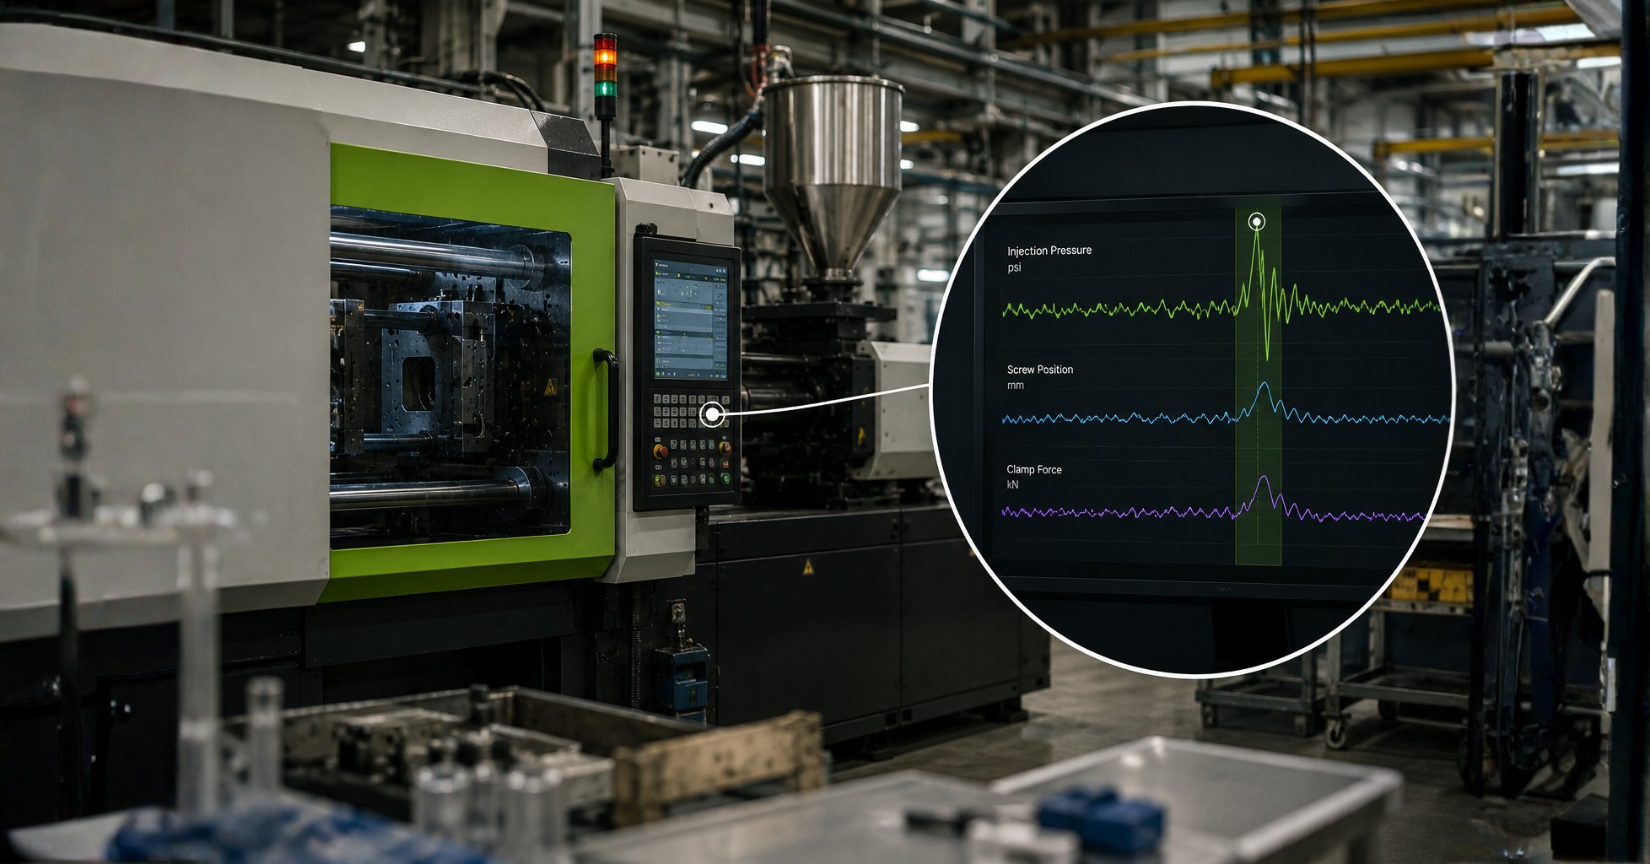

There's a tempting assumption in machine monitoring: if you want better visibility, capture more data. Log faster. Store everything. The full picture will emerge from the volume. It's a reasonable instinct. But for OEMs running high-speed, high-cycle, or safety-critical machines, it runs into a hard problem — and solving that problem is exactly what led us to build MONITOR + High-Resolution Data.
The gap that standard monitoring leaves
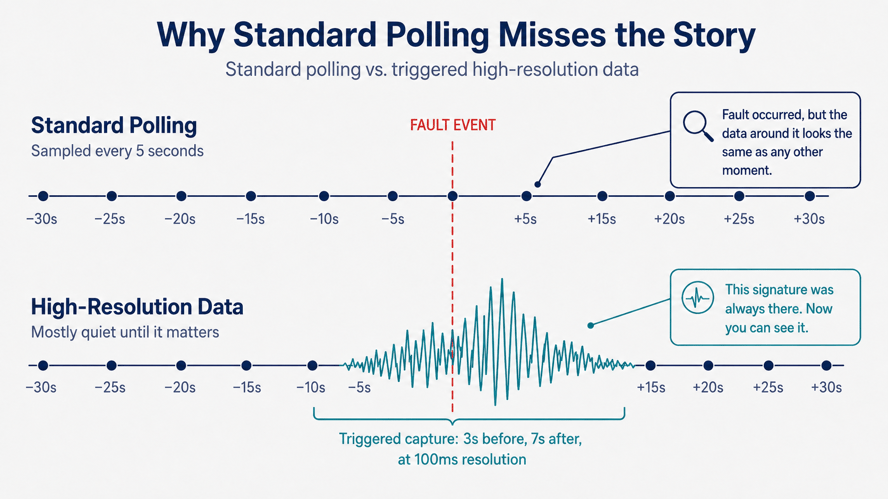
Most industrial monitoring systems — including the one you're probably running today — collect data on polling cycles. Every few seconds, or every minute, the system reads a set of values and records them. This works well for what it's designed to do: tracking trends, flagging sustained anomalies, generating alarms when a value stays out of range.
What it doesn't do well is capture what actually happened around a machine event.
Consider a screw conveyor that trips on an over-torque fault. Your monitoring system recorded torque values at 30-second intervals. The fault shows up in your data — but the pressure curve, the RPM behavior, and the thermal signature that preceded the trip by 200 milliseconds? Gone. The alarm fired; the story that led to it was never captured.
For machines where meaningful events unfold in milliseconds — bulk material processing, automated packaging lines, combustion systems — this is a recurring frustration. You know something happened. You don't know why, and you don't have the data to find out.
The brute-force solution and why it doesn't scale
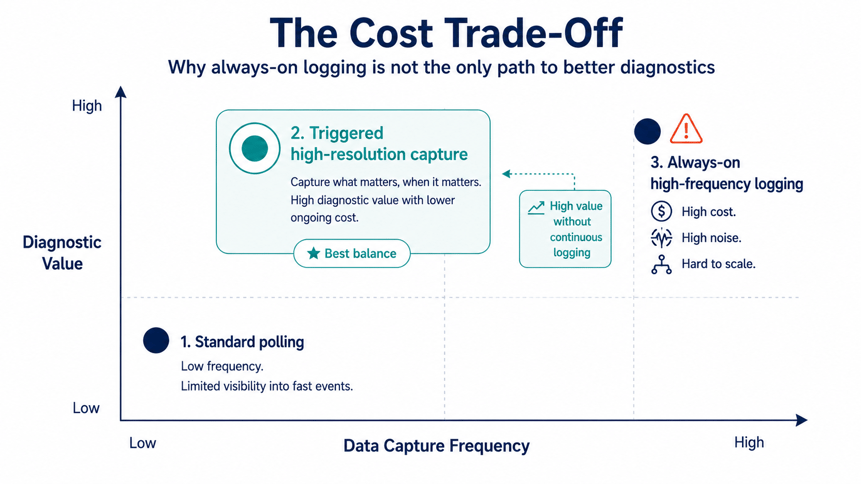
The obvious answer is to capture everything at high frequency, all the time. Set your sampling rate to 100ms, log every signal continuously, and you'll never miss a signature again.
In practice, this creates a different set of problems:
⚠️ Ingestion cost. Sending high-frequency data streams from every machine to your monitoring platform adds up fast — in cloud storage, data transfer, and processing costs. At scale, across a fleet, this becomes significant.
⚠️ Noise. High-frequency logs are large and hard to navigate. Finding the relevant window around an event means sifting through orders of magnitude more data than you actually needed.
⚠️ Infrastructure strain. Always-on high-resolution collection puts consistent load on edge hardware, network connections, and backend systems — even when nothing interesting is happening.
The result is that most teams face a trade-off: either accept the limitations of slow polling, or pay the cost of logging everything and deal with the volume.
A different approach: capture what matters, when it matters
High-Resolution Data is built around a different model: event-triggered capture.
Rather than logging continuously at high frequency, you define the conditions that matter — a pressure threshold, a torque spike, a status change, a rate-of-change alarm. When that condition is met, high-resolution capture activates. The system records a configurable window of data around the trigger event, at sampling rates down to 100ms, across any signals you've defined.
The result: you get the full picture of what happened around the moment that matters, without the cost of capturing everything all the time.
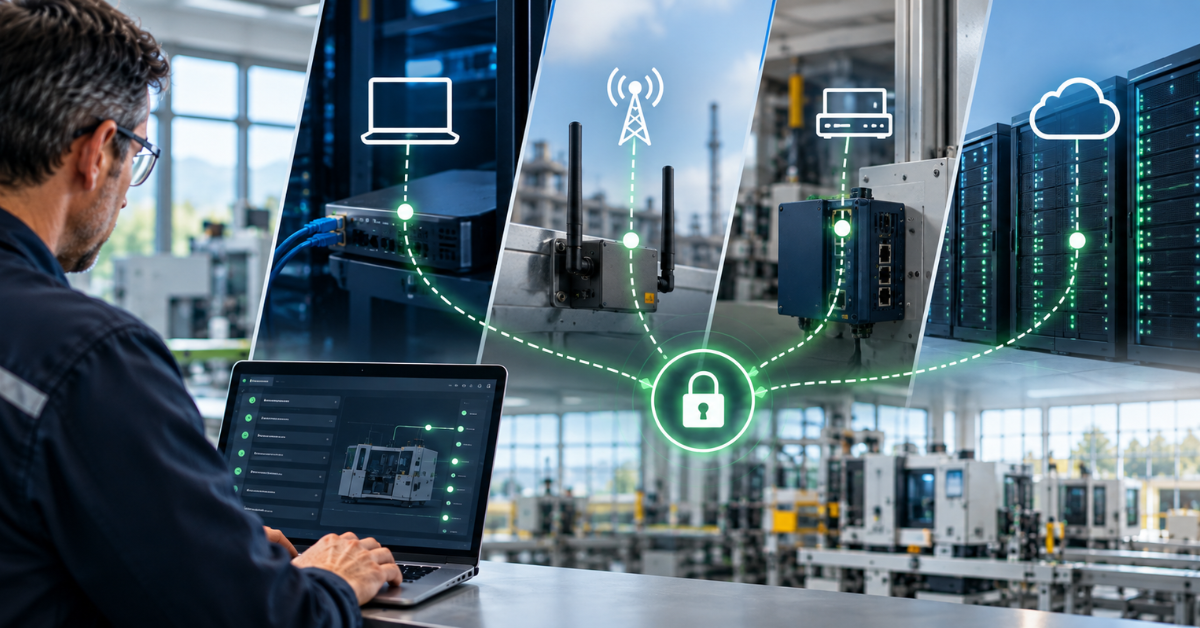
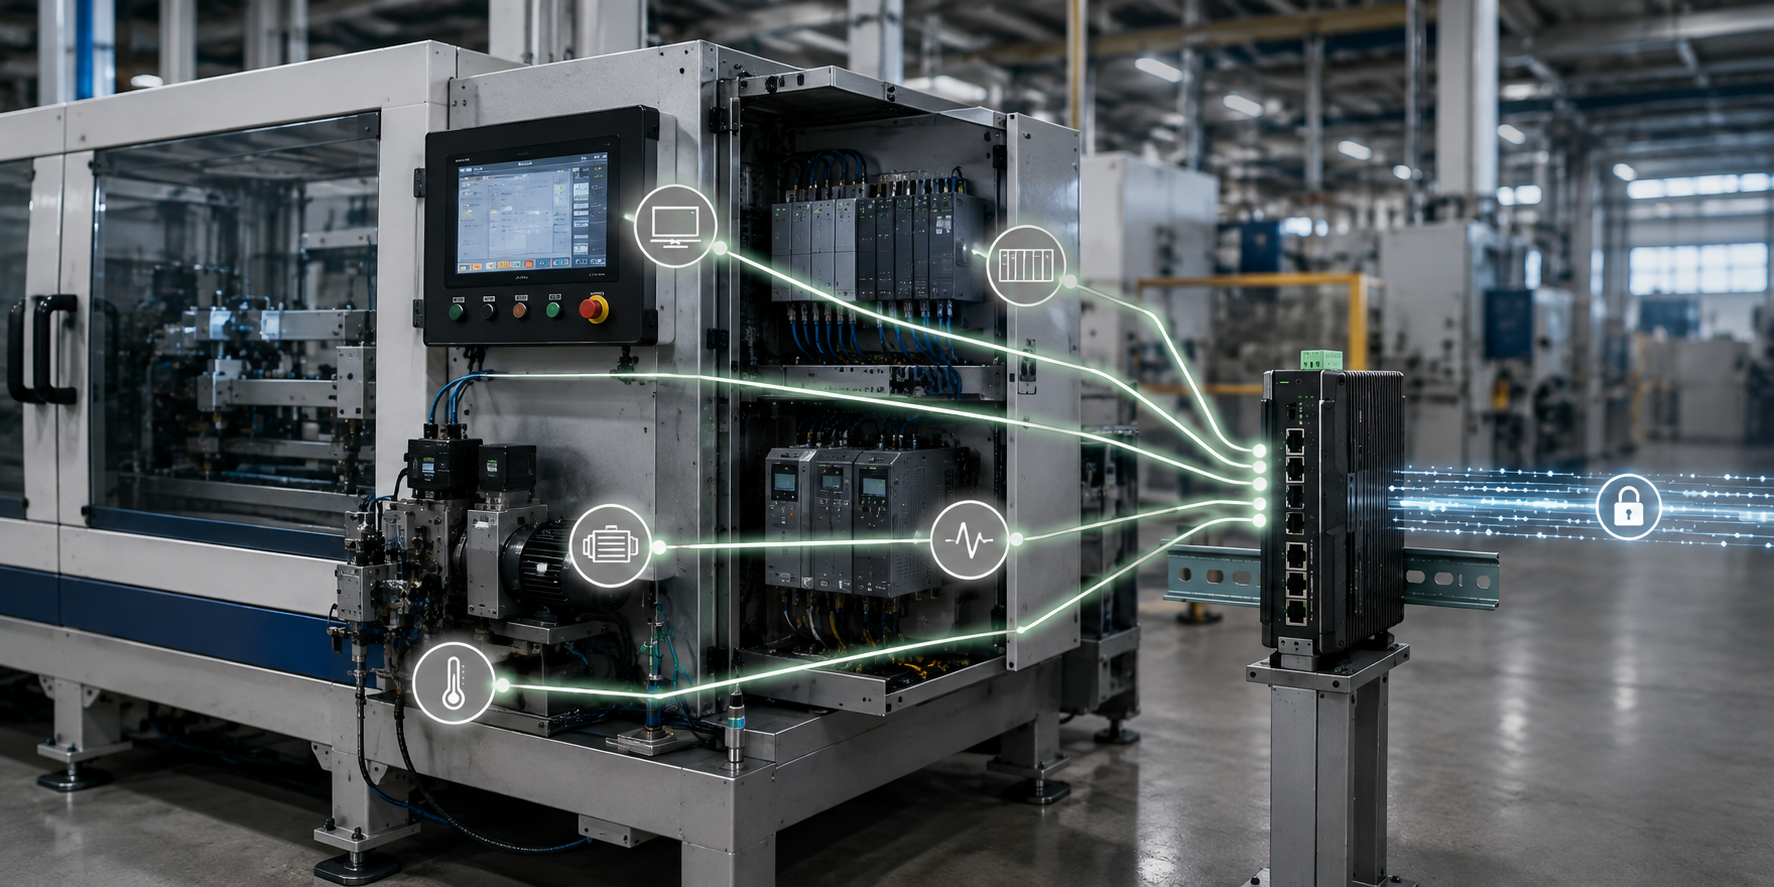
This is possible because collection happens at the edge — on the Amphion or Zethus gateway already deployed on your machines. The intelligence to detect a trigger condition, activate capture, and store the resulting data frame lives locally, not in the cloud. No network connectivity required at the moment of capture. No data lost during a connectivity gap.
Data frames: seeing before and after
One of the more powerful aspects of this approach is the concept of a data frame — a configurable time window captured around a trigger event.
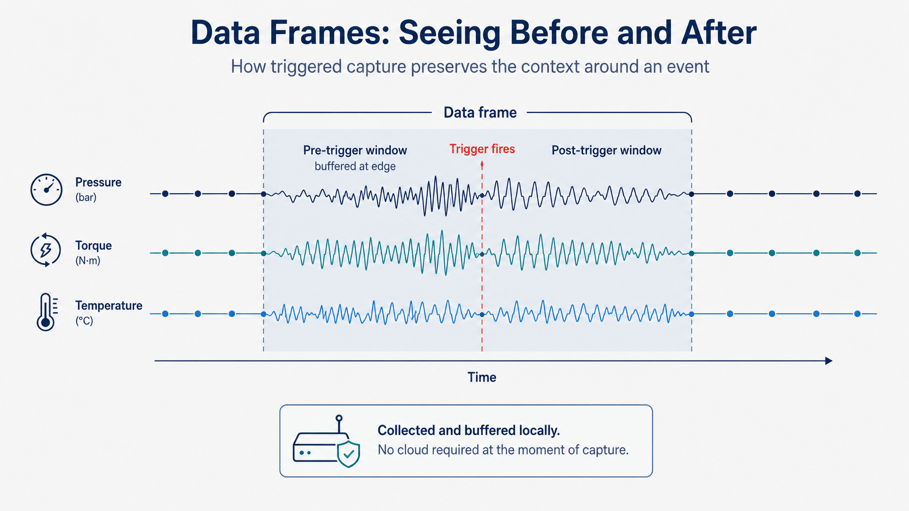
A trigger fires because something happened. But the most useful data for diagnosing that event is often what happened before it — the seconds or milliseconds of machine behavior that preceded the fault, the alarm, or the anomaly.
Because the Amphion is continuously collecting and buffering data at the edge, a triggered capture can reach back in time and include the pre-event window, not just the data after the trigger fired. You can configure frames to capture, for example, 5 seconds before and 5 seconds after a trigger — giving you the complete signature of the event, not just its aftermath.
For cyclic processes like automated assembly or packaging lines, this is especially valuable. You can compare high-resolution captures from one cycle to the next, and see exactly where — and how — the behavior is changing.
How teams can use MONITOR + High-Resolution Data
A few examples across machine types:
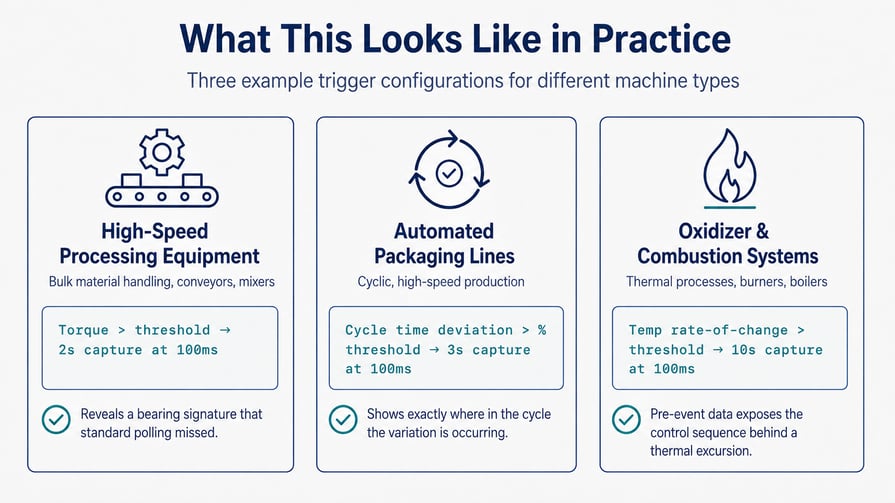
High-speed processing equipment. A torque spike triggers a 2-second capture window across pressure, RPM, and temperature at 10ms resolution. The resulting data reveals a bearing signature that's been building for weeks — invisible in the standard polling data, clear in the triggered capture.
Automated packaging lines. A cycle time deviation trigger fires whenever a cycle takes more than a defined percentage longer than baseline. The captured frame shows exactly where in the cycle the variation is occurring — narrowing a days-long investigation to a single actuator.
Oxidizer and combustion systems. A temperature rate-of-change trigger captures a 10-second window leading up to a thermal excursion. The pre-event data shows a control sequence that, in hindsight, should have been flagged — turning a reactive investigation into a preventive configuration change.
A note on data retention
One thing worth planning for: even with intelligent, triggered capture, high-resolution data frames accumulate over time. Because you're capturing at much higher fidelity than standard monitoring, the question of how long to retain that data becomes relevant — and the right answer varies depending on your use case.
For fault investigation, you may only need to retain captures for days or weeks. For long-term process baseline comparison or compliance-driven audit trails, you may want months or longer. ei3's approach is to make retention configurable — so you're storing what you actually need, for as long as you actually need it, rather than managing a one-size-fits-all policy that doesn't fit either side of that trade-off well.
How it fits into your existing setup
High-Resolution Data is an advanced + feature for MONITOR — not a separate platform, not a new interface. Triggered captures surface in MONITOR alongside your standard data, in the same environment your team already uses.
Configuration is done entirely from the cloud. No code, no deployment, no changes to your on-machine setup. You define your data points, triggers, and frame windows through the platform, and the configuration deploys instantly to your Amphion hardware.
The question to ask about your machines
If your team has ever looked at a fault log and wished you could see what led up to it — or has avoided high-frequency logging because of the cost and complexity — High-Resolution Data is worth a closer look.
The machines that benefit most are those where:
- Events that matter unfold in milliseconds or seconds
- Process cycles repeat, and variation between cycles is meaningful
- Safety-critical conditions require a full audit trail, not just an alarm timestamp
If that sounds like the machines you're building or servicing, talk to our team about adding it to your MONITOR deployment.
Monitor + High-Resolution Data is available now for ei3 partners. Learn more here →
ABOUT THE AUTHOR
The ei3 Team includes experts across industrial automation, cybersecurity, remote service, connectivity, and IIoT technologies. Combining experience across technical, operational, and customer-facing roles, the team shares insights and practical strategies that help OEMs and manufacturers improve machine performance, security, and operational visibility.


.svg)
.svg)
.svg)